This is a cautionary tale about the risk of drawing wrong conclusions when being unable to — self‑check — one's own data interpretation. Whereby turning analyzer usage into a video game. And treating the on‑screen data as gospel with blind faith. To paraphrase Jamie Anderson:
"Calling it (the hardware and/or software) analyzer is a misnomer,
the operator is the analyzer."
— Jamie Anderson —
President and founding member of Rational Acoustics
This article is prompted by a question I read on social media. Whose numerical values I slightly modified for educational purposes.
"When phase aligning mains to subs, which is better? 10 ms of delay on the mains,
or 5 ms of delay with a polarity inversion. Both cause the phase traces
to line up perfectly through the crossover region..."
This article explains why the inquirer's observation — perfectly — lined up phase traces, that is, traces whose slopes match and overlap throughout crossover, when using two — constant — albeit different, delay values, is unexpected.
Where the inquirer's question suggests a lack of foundational knowledge that lets one — self‑check — the plausibility of the on‑screen data. In this instance, equally well‑aligned outcomes for two different delay values.
"If you don’t know the answer before you start to measure,
how do you know you are getting a good measurement?"
- Ivan Beaver -
Chief Engineer at Danley Sound Labs
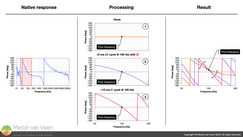
The proof is in the pudding Figure 1The left side of Figure 1 shows the native phase response of some arbitrary loudspeaker.
Let us focus on the two‑octave‑wide crossover range centered at 100 Hz. And explore three scenarios where we apply: a) no processing,
b) +5 ms together with a polarity inversion (⌀),
and c) +10 ms delay.
In serial signal processing, amplitudes are multiplicative whereas phases are additive. So we can simply add the phase shift introduced by delay to our loudspeaker's native phase response.
As long as we add (or take out) delay equal to an integer multiple \(±\, k\) of the time period for what I call the "pivot frequency" (in these examples 100 Hz whose time period is 10 ms). Or an integer multiple shifted by one half \(±\, k+0,5\) in combination with a polarity inversion. Noting that \(k\) may also be zero. A — pure tone — at the pivot frequency shall always remain in phase (not to be mistaken for on time).
Spend some time in my — free — phase calculator to appreciate why this is true for pure tones (sinusoids).
Which is why in all three scenarios, the apparent phase values solely for 100 Hz, on a bounded — wrapped — phase scale, appear unaffected in the result plot in the right of Figure 1.
Notice however, that the phase traces' slopes that intersect the pivot frequency increase from shallower to steeper. A phenomenon I call the "seesaw" about the pivot frequency. And that no two resulting phase traces are alike.
Demonstrating that the observation in the question that prompted this article, equally well‑aligned outcomes for two different delay values, cannot be true.
Maybe this satisfies your curiosity. But it does not explain — why — it cannot be true. And to reach the next level of enlightenment, we have to look at some — simple — math. In which case, keep on reading.
If math is not your second or third language, feel free to stop reading. Where you will just have to take my word for it. At the expense of being unable to — self‑check — your own data interpretation. And prevent drawing wrong conclusions.
I will derive the — same — explanation through two slightly different approaches.
Approach #1
Phase, in angular units (cycles, radians, or degrees), informs us at what phase (read: stage), that is — where — a sinusoid is in completing one or more cycles.
Since a sinusoid's time period informs us how long it takes to complete a — single — cycle. We can leverage Equation 1 to figure out phase when a certain amount of time has expired.
\begin{equation}\phi (T_{f})=-\frac{\tau}{T_{f}}\end{equation}
Where \(\phi\) is phase shift in — cycles — as a function of time period \(T_{f}\) in seconds per cycle, for a given delay \(\tau\) (Greek letter Tau) in seconds.
The minus sign in Equation 1 ensures that a waveform, when observed on an oscilloscope or in a DAW, slides to the right after applying positive delay.
We can make Equation 1 a function of frequency in hertz (cycles per second) rather than time period (seconds per cycle). Bearing in mind that time period is the reciprocal of frequency where \(T=\frac{1}{f}\).
\begin{equation}\phi (f)=-\frac{\tau}{\left ( \frac{1}{f} \right )}=-\tau \, f\end{equation}
Now that we know how many — cycles — a sinusoid will shift for a given delay. We can — convert — to phase in degrees by multiplying the outcome by 360.
\begin{equation}\phi (f)=-360\, \tau \, f\end{equation}
Where \(\phi\) is now phase shift in — degrees — as a function of frequency in hertz.
Bearing in mind that phase shift expressed in angular units such as cycles, radians, or degrees, is a matter of convenience.
Approach #2
Phase delay measures the time delay of — individual — sinusoids (read: pure tones) based on their phases. Traditionally, this involves radians for the angular unit.
\begin{equation}\tau _{\phi }(\omega )=-\frac{\phi (\omega )}{\omega }\end{equation}
Where \(\tau_{\phi}\) is phase delay in seconds as function of angular frequency \(\omega\) in radians per second, and \(\phi\) the phase shift in radians as function of angular frequency \(\omega\).
We can rearrange Equation 4 to get phase shift in radians, by solving for delay \(\tau\). Bearing in mind that — constant — delay is frequency independent.
\begin{equation}\phi (\omega )=-\tau\, \omega\end{equation}
Noting that angular frequency \(\omega=2 \pi\, f \) we can divide both sides of Equation 5 by \(2\pi\).
\begin{equation}{\color{Green} {\phi (f )}}={\color{Red} {-\tau}}\, f\end{equation}
Where \(\phi\) is now phase shift in — cycles — as a function of frequency in hertz (cycles per second). And yields exactly the — same — result as Equation 2 obtained through the first approach.
Straight lines
Equation 6 is a linear equation in the slope‑intercept form (shown below in Equation 7) that describes a straight line.
\begin{equation}{\color{Green} y}={\color{Red} m}\, x+{\color{Blue} b}\end{equation}
Where \({\color{Red} m}\) denotes the line's slope and \({\color{Blue} b}\) where the line intercepts the y‑axis.
In Equation 6 \({\color{Green} y}\) is \({\color{Green} {\phi (f )}}\), slope \({\color{Red} m}\) is \({\color{Red} {-\tau}}\), \(x\) is \(f\), and the y‑intercept \({\color{Blue} b}\) is zero. Making the function go through the origin. Since phase shift at 0 Hz is always zero angular units (regardless of cycles, radians, or degrees) for — any — delay. Because multiplying any delay value by zero (hertz) always yields zero angular units phase shift.
And irrefutably proves that the slope of a phase trace caused by — constant — delay is both proportional to that delay as well as straight (not to be mistaken for flat). And — cannot — be the same for two different delay values.
And explains why the observation in the question that prompted this article, equally well‑aligned outcomes for two different delay values, cannot be true. And should have prompted the inquirer to further investigate — why — both outcomes "appeared" to be similar.
Understanding this fundamental theory is just one example of empowering oneself to — self‑check — and discard implausible observations.
Let us see Equation 6 in action.
It is all about the slope Figure 2
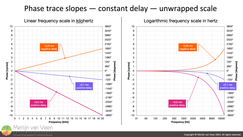
Figure 2 shows the slopes for three different delay values. Once on a linear frequency scale in kilohertz (to the left of Figure 2). And once on logarithmic scale in hertz (to the right of Figure 2).
For each plot the phase shift is shown in both cycles (primary left y‑axis) as well as degrees (secondary right y‑axis).
On a linear scale (left plot in Figure 2) it is readily apparent that the — constant — slopes are proportional to \(-\tau\) whose steepness increase with increasing delay amounts. Furthermore, notice that positive delay values result in negative slopes. Whereas negative delay values result in positive slopes.
In other words, a negative phase slope means lagging. Whereas a positive phase slope means leading. And no slope means on time.
Unfortunately, due to the warping effect when migrating from a linear to a logarithmic frequency scale, those pretty straight line‑traces with their constant slopes no longer — appear — to have constant slopes.
Clearly, "looks" on a logarithmic scale are deceiving. It's a trap! Do not take the bait. And yet, this is what constant delays look like on a logarithmic scale. Do not get fooled.
Furthermore, the phase axes in Figure 2 are unbounded, that is, unlimited. They have no lower limit (floor) or higher limit (ceiling). Whereas our analyzers default to a bounded, that is, limited phase axis, that merely spans one cycle. Whose floor is -180° and ceiling +180°. Where no excess axis is left over for plotting values in excess of ±180°.
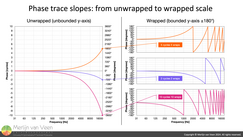
From unwrapped to wrapped Figure 3Figure 3 shows what happens when we "wrap" our initial phase traces on a logarithmic scale with unbounded phase axis (left plot in Figure 3). And display them with a bounded "wrapped" phase axis (right plots in Figure 3).
By now it should become clear why it is convenient to be bilingual between expressing phase shift in cycles as well as degrees (Equations 2 and 3). Since the number of wraps in the wrapped plots equals the number of cycles delay come 20 kHz.
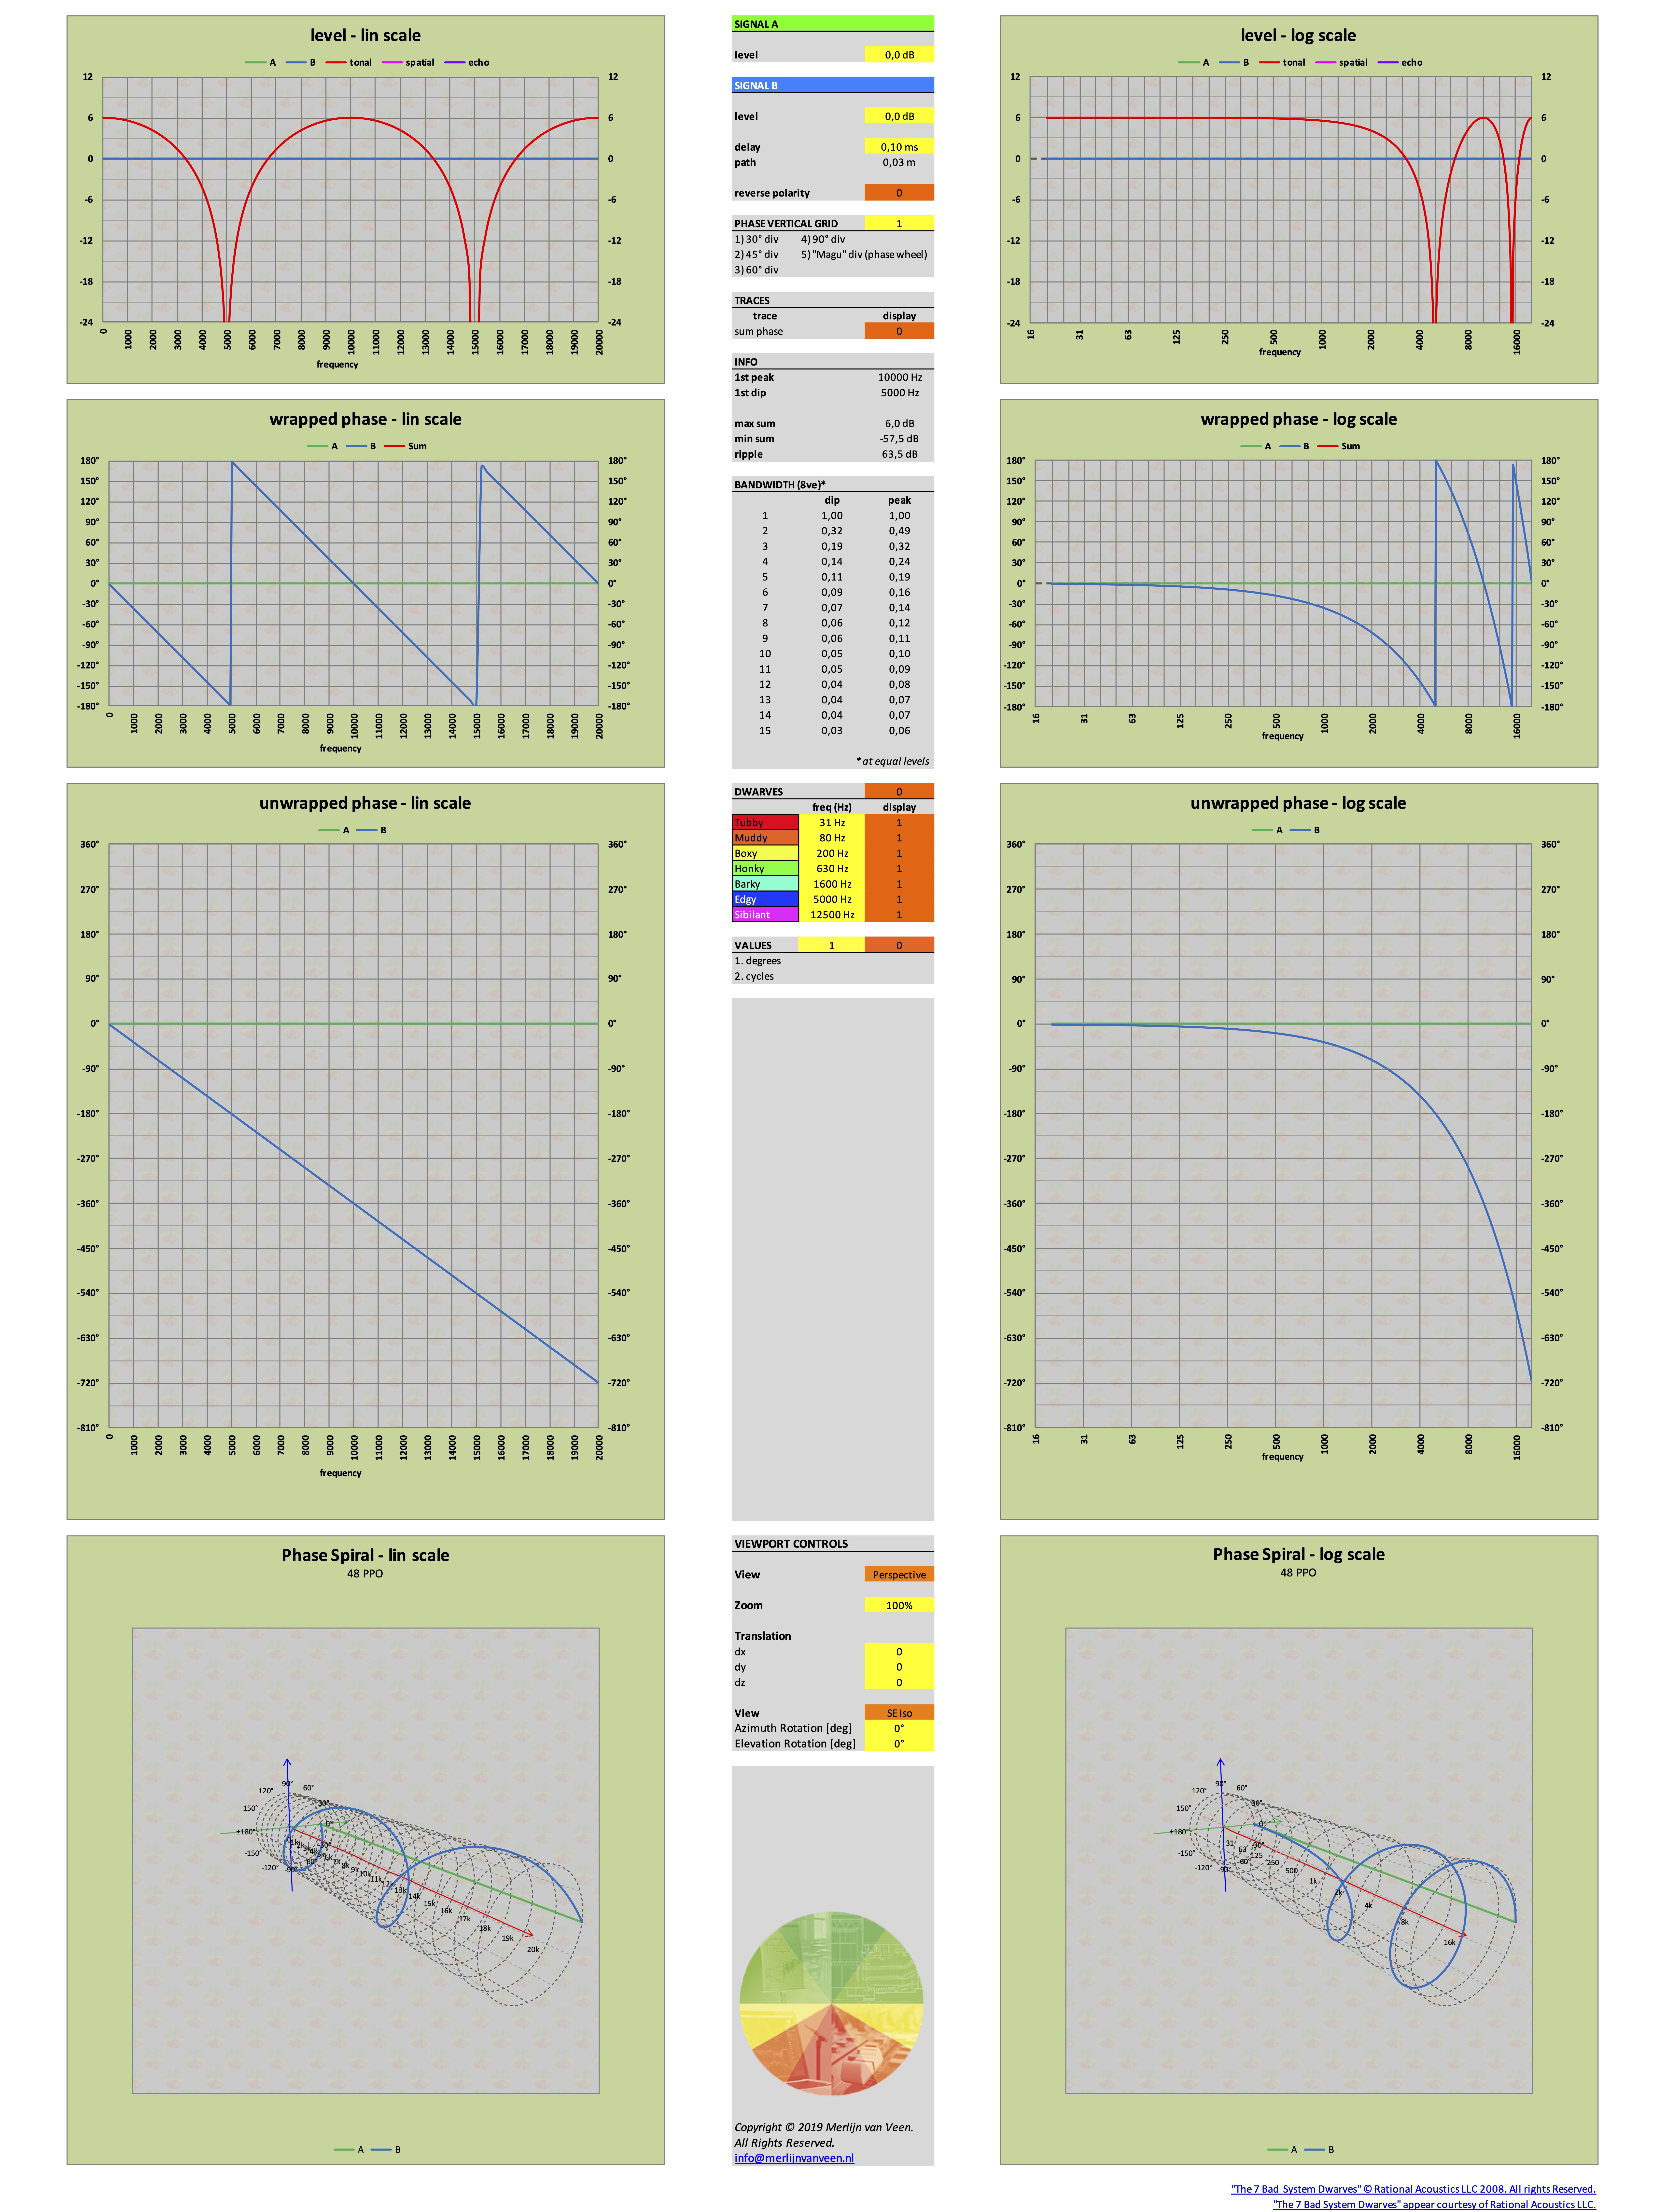
An exhaustive explanation of the conversion from unwrapped to wrapped phase response falls outside the scope of this article. But hopefully the image from my — free — phase calculator (shown bellow) makes you curious enough to play with it and find out on your own.
