This article explores reasons for considering frequency shading — as opposed to gain shading — to optimize the tonal uniformity of line arrays.
"I envy people that spend their carreers in studios or post‑production facilities.
Because there will never be enough air between them and their studio monitors
for air absorption to become a problem."
— Merlijn van Veen —
Law of diminishing returns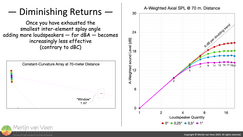 Figure 1Figure 1 shows four scenarios for the on‑axis A‑weighted sound level — with air absorption — at 70 meters distance (230 feet) of constant‑curvature arrays as a function of element quantity.
Where each scenario considers a different amount of fixed splay per element. Ranging from 0° splay per element, that is, a — straight — array without curvature altogether, to as much as 1° per element.
The black dashed line shows the ideal trend where each doubling of element quantity yields 6 dB more sound level. Notice that for all four scenarios — at 70 meters distance — efficiency for up to three elements follows the ideal trend regardless of inter‑element splay, that is, curvature.
But, as more elements are added, inter‑element splay, and subsequently array curvature, reduce efficiency. Where each scenario eventually tapers off asymptotically.
For the scenario with 1° splay per element, beyond seven elements, adding more elements makes a mere 1 dB difference. Whereas for 0,5° and 0,25° the tipping point (of diminished returns) is nine and 11 elements respectively. Even the straight array, with 0° inter‑element splay — which is bad practice for reasons beyond the scope of this article — cannot keep up with the ideal. And tapers off around 13 elements.
So once one has exhausted the smallest inter‑element splay angle, adding more elements — whose splay is the same — to raise the A‑weighted sound level (at a given distance) becomes futile. It is also worth noting that (come 70 meters distance) the sound level differences between 0,25°, 0,5°, or 1°, merely span about 3 dB.
Let us dig deeper by performing a third‑octave breakdown for the scenario featuring a large‑format array whose smallest splay option is 0,5°.
Third octaves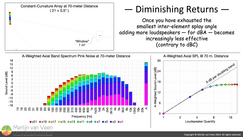 Figure 2Figure 2 shows third‑octave band spectra as a function of element quantity for a large‑format array whose smallest splay option is 0,5°.
Notice that for frequencies which tend to be subject to air absorption — 4 kHz and higher — adding additional elements in excess of five (as opposed to nine for broadband A‑weighted sound levels) makes no difference.
Thus, as far as "fairy dust" is concerned, overshooting the last row by two elements tends to already suffice for maximizing high‑frequency sound levels. Whereas overshooting by four elements (two more) tends to maximize A‑weighted sound levels, but no longer the former.
Now that we have some practical quantity limits, let us apply this to a large‑scale Main PA.
Array design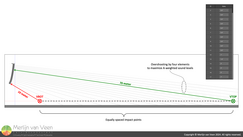 Figure 3The large‑format array in Figure 3 has been configured to maximize A‑weighed sound levels for a range ratio of 7 : 1, that is, the nearest audience members — within the array's vertical coverage — are seven times closer than the most distant audience members.
For a purely omni‑directional source, the same range ratio constitutes a drop in direct‑sound level of \(20\times log_{10}(7)=17\: dB\). Which is 11 dB more than the maximum front‑to‑back level variance one tends to accept, that is, 6 dB. Therefore, the challenge becomes to set inter‑element splays such that 11 dB more amplitude is sent to the last row than the first row.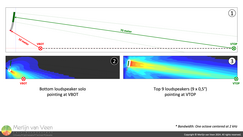 Figure 4Figure 4.2 shows the bottom loudspeaker — alone — aimed at VBOT (vertical bottom) the start of coverage. Whereas Figure 4.3 shows the top nine loudspeakers — together — aimed at VTOP (vertical top) the end of coverage.
Bearing in mind that for an array whose smallest splay option is 0,5°, nine elements tend to maximize distant A‑weighted sound levels (Figures 1 and 2).
Notice that despite overshooting with four elements, for the octave centered at 2 kHz, the "tip of the flame" is clearly pointing at VTOP.
Without air absorption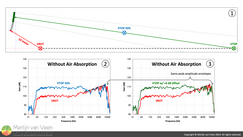 Figure 5Figure 5.2 compares the frequency responses — without air absorption — of the bottom loudspeaker soloed and the top nine loudspeakers together at 50% of the distance to VTOP.
Without air absorption, for the frequencies which tend to be subject to air absorption — 4 kHz and higher — one can clearly see that the imaginary "eyeball" envelopes over the responses' peaks match. And subsequently so do high‑frequency sound levels.
In other words, nine loudspeakers together at 35 meters distance — for high frequencies — are just as loud as one loudspeaker on its own at 10 meters distance.
Whereas the response difference below 4 kHz is due to the mutual coupling — with decreasing frequency — of nine elements versus a single element. And whether or not one finds oneself — for a given frequency — in the near‑ or far‑field to the array.
When one doubles the distance from VTOP 50% to VTOP, in exchange for a 6 dB drop in level, one gets the frequency responses in Figure 5.3. Nevertheless, the imaginary "eyeball" envelopes over the responses' peaks — albeit with a 6 dB trace offset — continue to match. And subsequently so do high‑frequency sound levels.
In other words — without air absorption — for 4 kHz and up, high‑frequency level would drop by 6 dB when moving along a straight line from VBOT to VTOP.
With air absorption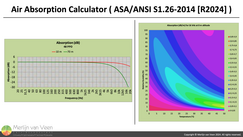 Figure 6Figure 6 shows a forecast of air absorption as a function of frequency, at a given distance, in accordance with standard ASA/ANSI S1.26‑2014 (R2024). These plots come from the author's own Air Absorption calculator.
Since air absorption attenuates by a frequency‑dependent, but — constant — amount (typically a fraction of a decibel) per meter distance. It should not come as a surprise that at 10 meters distance one suffers seven times less attenuation (in decibels) than at 70 meters distance.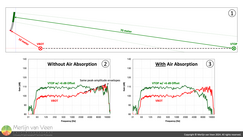 Figure 7And when taken into consideration, yields the result shown in Figure 7.3. Where our initial 6 dB of front‑to‑back level variance (without air absorption) has been inflated by about another 10 dB at 10 kHz. And even more for higher frequencies.
In order to preserve tonality over distance, all frequencies should loose market share — at the same rate — with increasing distance. Hence the need for frequency shading to minimize high‑frequency tonal variation.
Which typically involves dividing the array in zones. And apply a gentle taper, top to bottom, by virtue of PEQ or shelving filters. Which may involve cutting as well as boosting. Bearing in mind that electrical power is proportional to the — square — of voltage. So while a "modest" 6 dB boost constitutes only twice the voltage, it takes four times the amount of electrical power.
And where increasing the number of zones, preferably two elements per zone, increases granularity. Which minimizes the risk for "acoustic shock". Where one detects artifacts at the seams between adjacent zones due to sudden level steps that are too coarse.
Not to mention that one should also be mindful of sonic intimacy. And match sound to sight. After all, as Bob McCarthy likes to say:
"I like Bonnie Raitt.
But, at 80 meters distance,
I do not expect her to sound like she's sticking her tongue in my ear."
— Bob "6o6" McCarthy —
So oftentimes it is undesirable to fully compensate for all air absorption losses. In an attempt to minimize high‑frequency tonal variation throughout the audience. And for large‑scale PA, the author tends to raise the white flag, and surrenders to air absorption, for frequencies beyond 10 kHz to 12,5 kHz.
But some frequency shading is mandatory. Especially between the audience start and front of house. Since that is where the artistic decision‑making takes place. And one wants to deliver that same experience — with equal amounts of "fairy dust" — to spectators close to the stage.
Two birds with one stone
If one mechanically articulates their arrays (read: set one's splays) to loose at most 6 dB front‑to‑back for mid frequencies, that is, the octaves centered at 2 kHz and 4 kHz. One can leverage frequency shading to further minimize level variance electronically as well as tonal variance (due to air absorption). By having shallow shelving filters incorporate those frequencies as well.
Contrary to — gain — shading, this will leave low‑mid frequencies untouched. Whereby preserving maximum line length which is the driving force behind controlling those frequencies' vertical dispersion.
Word on C—A levels
While this article may feel A‑weighting‑centric. The author is very much aware that adding more elements may sometimes be desirable to further raise C‑weighted sound levels. Even when A‑weighted sound levels are already satisfied. Since C—A (read: C minus A) levels greatly depend on program content.
